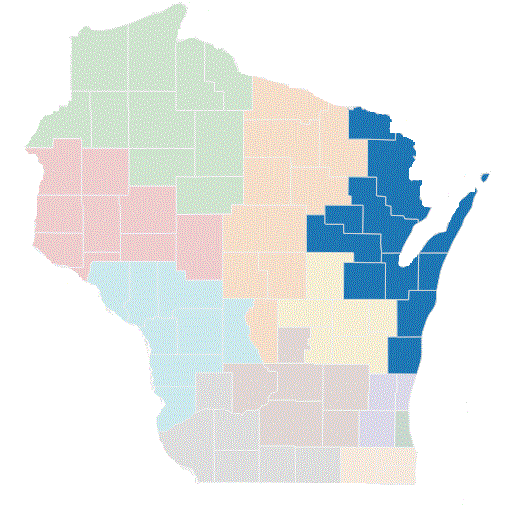
WDA Bay Area
Workforce Development Area Directory
WDA 5 - Bay Area
Brown, Door, Florence, Kewaunee, Manitowoc, Marinette, Menominee, Oconto, Outagamie, Shawano, and Sheboygan Counties
Board Web Directory:
Bay Area Workforce Development Board
Ryan Long
email or call (920) 930-6557
Ryan Long is the Labor Market Economist of the Bay Area and Fox Valley regions for the Office of Economic Advisors. He is from Rockford, Illinois and graduated from Northern Illinois University in 2017 with a B.A. cum laude in Economics. Ryan has been working with the OEA since September of 2017. He looks forward to serving northeast Wisconsin.
Description
The Bay Area is made up of 11 counties in the Northeastern area of the State of Wisconsin. The counties include Brown, Door, Florence, Kewaunee, Manitowoc, Marinette, Menominee, Oconto, Outagamie, Shawano, and Sheboygan. Five of the counties in the area are designated as metropolitan statistical areas (MSA).
The Green Bay Metropolitan Statistical Area (MSA) is the largest of the three MSA's in the area (including the Outagamie County portion of the Appleton MSA and the Sheboygan MSA) and contains approximately 38 percent of the labor force and employment in the WDA. It makes up about 37 percent of the population for the Bay Area, and is near the geographical center of the region. Manufacturing makes up just over 18 percent of the employment, with the predominant industry being paper making, both in scale of employment and average annual salary.
Sheboygan County is the other MSA whose boundaries are wholly within the Bay Area. It is slightly less than one half the size of the Green Bay MSA in terms of employment and labor force. It is also the southernmost county in the area. Approximately 40 percent of the county's employment is in the manufacturing sector, double the statewide average.
DEMOGRAPHICS
Wisconsin's Bay Area WDA has 7,228 sq. miles in land area and a population density of 111 people per square mile. From 1970 to 2010, WDA 5's population grew by 34.3%
WDA 5 has a total of 245* K-12 public schools. There are 13 post-secondary schools, including
5 WI Tech College Campuses.
In 2011, manufacturing was the largest of the 11 major industrial sectors within WDA 5 with an
average annual wage of $47,907.** Per capita income grew by 30.8% between 2000 and 2010. ***
* Wisconsin Department of Public Instruction
** Quarterly Census of Employment and Wages, Labor Market Information Section, WI DWD
** United States Bureau of Economic Analysis, Department of Commerce

Regional Information
County Profiles
WDA and Wisconsin Hot Jobs
Occupational & Industry Employment Downloads
| File Name | File Type | File Size | Description |
|---|---|---|---|
| Long-Term: 2022-2032 Hot Job Projections - WDA | Excel | 53 KB | Regional Occupational Employment Projections |
| Long-Term: 2022-2032 Occupational Projections - WDA | Excel | 1,136 KB | Regional Occupational Employment Projections |
| Long-Term: 2022-2032 Industry Employment Projections - WDA | Excel | 48.8 KB | Regional Industry Employment Projections |
State Information
Occupational & Industry Employment Downloads
| File Name | File Type | File Size | Description |
|---|---|---|---|
| Long-Term: 2022-2032 Hot Job Projections - Wisconsin | Excel | 24 KB | State Occupational Employment Projections |
| Short-Term: 2023-2025 Industry Employment Projections - Statewide | Excel | 38 KB | Statewide Industry Employment Projections |
| Long-Term: 2022-2032 Industry Employment Projections - Statewide | Excel | 41 KB | Statewide Industry Employment Projections |
| Short-Term: 2023-2025 Occupational Projections - Statewide | Excel | 135 KB | Statewide Occupational Employment Projections |
| Long-Term: 2022-2032 Occupational Projections - Statewide | Excel | 141 KB | Statewide Occupational Employment Projections |

