OEWS Details
Description
The Occupational Employment and Wage Statistics (OEWS) survey is a joint effort of the U.S. Department of Labor, Bureau of Statistics (BLS) and the Wisconsin Department of Workforce Development. The survey's purpose is to identify which occupations are in demand and to estimate the number of employees in each and the wages paid to them. OEWS collects this information for each state, the District of Columbia, the Virgin Islands, Puerto Rico and Guam.
A probability sample is used to create the estimates. BLS selects the sample and sends it to the relevant area for data collection. After collection, the state or territory sends the sample data to BLS, which estimates cross-industry occupational wages and employment. BLS then transmits the estimates back to the state for further processing and distribution to the public.
Sample
The OEWS Survey draws the major portion of the working sample from each state's or territory's Unemployment Insurance (UI) file. BLS starts by stratifying the firms in these files by area. In Wisconsin, establishments are stratified into fifteen Metropolitan Statistical Areas (MSA) and four Balance of State (BOS) areas. The Balance of State areas consist of counties that are not part of an MSA, and to the extent possible, contain contiguous counties that share a common economic base.
After stratifying by area, BLS stratifies the firms in each area into nine size classes, where size is measured by employment. Employment includes full-time or part-time workers who are on paid vacations or other types of leave; who are on unpaid short-term absences; who are salaried officers, executives, and staff members of incorporated firms; who are employees temporarily assigned to other units; and who are employees for whom the reporting unit is their permanent duty station regardless of whether that unit prepares their paycheck. The self-employed, owners/partners of unincorporated firms, and unpaid family workers are excluded.
Finally, establishments in each area and size class are further stratified by industry. BLS uses the North American Industry Classification System (NAICS) for this purpose. (Prior to the 2002 survey, it used the Standard Industrial Classification (SIC) system.) Industries covered include agricultural services; mining; construction; manufacturing; transportation and public utilities; wholesale and retail trade; finance, insurance, and real estate; and services. Link to the Census Bureau's North American Industrial Classification System (NAICS) page to learn more about NAICS.
After stratifying the firms in each state's or territory's UI file by area, size and industry, BLS selects a random sample from each stratum. It then adds state, federal, railroad and postal employees to these firms to construct the working sample used to generate the OEWS estimates. Finally, BLS assigns each sample firm a weight that reflects the number of firms represented by that unit.
The size classes are:
|
Size Class |
Employment |
|
1 |
1 - 4 |
|
2 |
5 - 9 |
|
3 |
10 - 19 |
|
4 |
20 - 49 |
|
5 |
50 - 99 |
|
6 |
100 - 249 |
|
7 |
250 - 499 |
|
8 |
500 - 999 |
|
9 |
1000 or More |
Data Collection
The sample is split into two panels. Firms in the first panel are asked to provide wage and employment information for the pay period that includes May 12th, and firms in the second panel are asked to provide information for the pay period that includes November 12th. (Prior to the 2002 survey, each establishment in the sample was asked to provide information for the pay period that included either October 12th, November 12th, or December 12th.) Contact is made through a mail survey starting the week of May 12th or November 12th. Firms that do not respond, receive two more mail surveys. Firms that still do not respond are contacted by email or telephone.
BLS sets certain conditions to assure the quality of the estimates. First, states must collect information from establishments employing at least 65 percent of the total employment and for at least 75 percent of all the units in the sample. Second, states must collect data for at least 70 percent of the sampled units or at least 75 percent of the sampled employment in each MSA and BOS.
Data Uses
OEWS data is used to analyze occupational employment and wages, develop occupational projections, vocational counseling and planning, industry skill and technology studies and labor market analysis.
The following table lists Wisconsin's Metro Statistical Areas (MSA) and the Wisconsin counties that comprise them:
| MSA | Counties |
| Appleton, WI MSA | Calumet, Outagamie |
| Chicago-Naperville-Elgin, IL-IN-WI MSA* | Kenosha |
| Duluth-Superior, MN-WI MSA* | Douglas |
| Eau Claire, WI MSA | Chippewa, Eau Claire |
| Fond du Lac, WI MSA | Fond du Lac |
| Green Bay, WI MSA | Brown, Kewaunee, Oconto |
| Janesville-Beloit, WI MSA | Rock |
| La Crosse, WI-MN MSA* | La Crosse |
| Madison, WI MSA | Columbia, Dane, Iowa |
| Milwaukee-Waukesha, West Allis, WI MSA | Milwaukee, Waukesha, Ozaukee, Washington |
| Minneapolis-St. Paul-Bloomington, MN-WI MSA* | Pierce, St Croix |
| Oshkosh-Neenah, WI MSA | Winnebago |
| Racine, WI MSA | Racine |
| Sheboygan, WI MSA | Sheboygan |
| Wausau, WI MSA | Marathon |
* The MSA includes counties in other states. Visit our geography page to see the counties included in out-of-state MSAs.
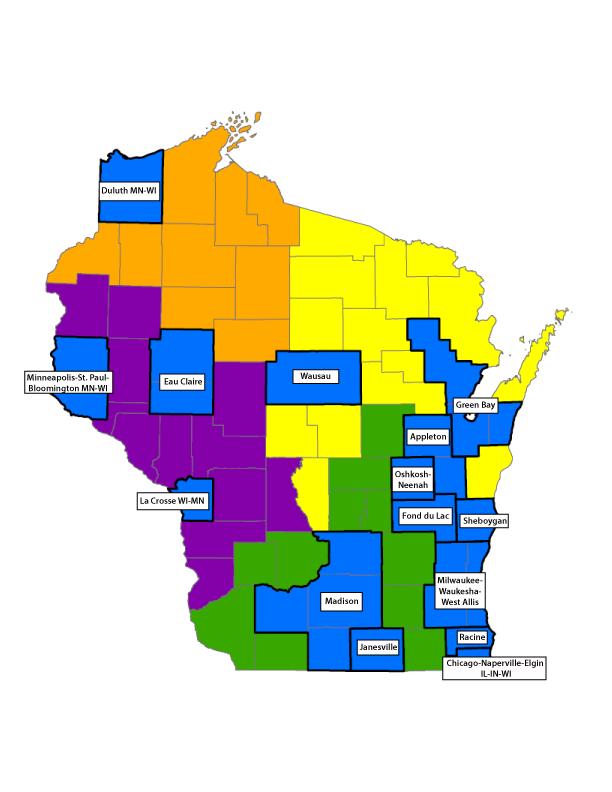
Map Legend
 |
Metro counties | |
 |
NW BOS 1 | Ashland, Bayfield, Burnett, Iron, Price, Rusk, Sawyer, Taylor, Washburn |
 |
NE BOS 2 | Adams, Door, Florence, Forest, Langlade, Lincoln, Manitowoc, Marinette, Menominee, Oneida, Portage, Shawano, Vilas, Wood |
 |
SC BOS 3 | Dodge, Grant, Green Lake, Jefferson, Lafayette, Marquette, Richland, Sauk, Walworth, Waupaca, Waushara |
 |
W BOS 4 | Barron, Buffalo, Clark, Crawford, Dunn, Jackson, Juneau, Monroe, Pepin, Polk, Trempealeau, Vernon |
In 2014, the Office of Management and Budget (OMB) redefined many of the nation's Metropolitan Statistical Areas (MSA). At that time, they also gave states the opportunity to redefine their Balance of State (BOS) areas. These areas consist of counties that are not part of an MSA. Wisconsin has defined four such areas. The Occupational Employment and Wage Statistics (OEWS) program implemented these changes with the release of the May 2015 estimates.
Occupations
The OEWS program uses the Standard Occupational Classification (SOC) system to classify occupations. A SOC code consists of six digits. The first two refer to the major group, the third refers to the minor group, the fourth and fifth refer to the broad occupation and the sixth refers to the detailed occupation. In the occupation coded 17-2112, for example, 17 refers to an occupation in the major group Architecture and Engineering Occupations, 2 refers to the minor group Engineers, 11 refers to the broad occupation Industrial Engineers, Including Health and Safety, and the last digit, 2, refers to the detailed occupation, Industrial Engineers. SOC categorizes workers into 22 major groups with nearly 800 detailed occupations.
The major groups are:
- Management occupations (Major Group 11)
- Business and financial operations occupations (Major Group 13)
- Computer and mathematical occupations (Major Group 15)
- Architecture and engineering occupations (Major Group 17)
- Life, physical, and social science occupations (Major Group 19)
- Community and social services occupations (Major Group 21)
- Legal occupations (Major Group 23)
- Education, training and library occupations (Major Group 25)
- Arts, design, entertainment, sports, and media occupations (Major Group 27)
- Healthcare practitioners and technical occupations (Major Group 29)
- Healthcare support occupations (Major Group 31)
- Protective service occupations (Major Group 33)
- Food preparation and serving related occupations (Major Group 35)
- Building and grounds cleaning and maintenance occupations (Major Group 37)
- Personal care and service occupations (Major Group 39)
- Sales and related occupations (Major Group 41)
- Office and administrative support occupations (Major Group 43)
- Farming, fishing, and forestry occupations (Major Group 45)
- Construction, and extraction occupations (Major Group 47)
- Installation, maintenance, and repair occupations (Major Group 49)
- Production occupations (Major Group 51)
- Transportation and material moving occupations (Major Group 53).
- Link to the Bureau of Labor Service's Standard Occupational Classification (SOC) page to learn more about the SOC system.
Wages
After an employee's occupational classification is determined, a wage range is assigned. Wages are straight-time, gross pay, exclusive of premium pay. Wages include base rate, cost-of-living adjustments, hazardous duty pay, incentive pay and on-call pay. Wages exclude back pay, jury duty pay, overtime pay, severance pay, shift differentials, nonproduction bonuses, employer cost of supplemental benefits and tuition reimbursements.
Wages fall into one of following 12 intervals:
|
Interval |
Hourly Wages |
Annual Wages |
|
Range A |
Under $9.25 |
Under $19,240 |
|
Range B |
$9.25 to $11.74 |
$19,240 to $24,439 |
|
Range C |
$11.75 to $14.74 |
$24,440 to $30,679 |
|
Range D |
$14.75 to $18.74 |
$30,680 to $38,999 |
|
Range E |
$18.75 to $23.99 |
$39,000 to $49,919 |
|
Range F |
$24.00 to $30.24 |
$49,920 to $62,919 |
|
Range G |
$30.25 to $38.49 |
$62,920 to $80,079 |
|
Range H |
$38.50 to $48.99 |
$80,080 to $101,919 |
|
Range I |
$49.00 to $61.99 |
$101,920 to $128,959 |
|
Range J |
$62.00 to $78.74 |
$128,960 to $163,799 |
|
Range K |
$78.75 to $99.99 |
$163,800 to $207,999 |
|
Range L |
$100.00 and Over |
$208,000 and Over |
Estimates
The Bureau of Labor Statistics uses Wisconsin's sample data to produce statewide cross-industry wage and employment estimates by occupations as well as for occupations in each of the fifteen MSAs and the four BOS areas. The average wage, the median wage, the 10th percentile wage, the 25th percentile wage, the 75th percentile wage, the 90th percentile wage, employment, the relative standard error of the average wage and the relative standard error of the employment estimate are calculated.
BLS combines three years of sample data to generate the OEWS estimates. The larger sample results in smaller standard errors. Until 2002, data was collected once a year. Starting in 2002, data is collected two times a year: a May panel and a November panel. Consequently, estimates through 2004 are based on a combination of panel and annual data. The 2002 estimates, for example, use data from the November panel of 2002 and data collected in the 2001 and 2000 survey years. (This set of estimates only uses 2.5 years of data.) The next set of estimates, the 2003 May panel, uses data from the May panel of 2003, the November panel of 2002 and the 2001 and 2000 survey years. After 2004, only panel data is used.
BLS uses the Employment Cost Index (ECI) to adjust wage data from previous years for inflation when combining panels.
As mentioned, the OEWS Survey does not collect actual wages. For each occupation, employers are asked to record the number of employees in wage intervals A through L. However, computation of the average wage paid to employees in an occupation requires an estimate of the total wages paid to the employees in that occupation. Wage information provided by employers and information from the BLS Office of Compensation and Working Conditions are used to compute this estimate. Except for wage interval L, where the lower bound of the wage interval is used as the mean (Winsorized Mean), the Office of Compensation and Working Conditions uses population data to compute a mean value for each wage interval. The mean value in each wage interval is multiplied by the establishment's weight and by the number of workers reported by the establishment in that wage interval. BLS then sums these values over the 12 wage intervals to find an estimate of the total wages paid to employees in the specified occupation employed by the establishment. This is repeated for all firms that report employees in the occupation. The sum of these values is the estimate of total wages paid to the occupation.
BLS estimates the total number of employees in each occupation by multiplying each firm's weight by the number of employees it reported in each wage interval and summing across all firms reporting employment in the occupation.
The estimated mean wage is found by dividing the estimate of total wages paid by the estimated number of employees. Estimated total wages paid are also used to compute the estimates of the various percentile wages.
BLS uses the standard 40-hour, 52-week year when estimating wages. Some employees, such as teachers and airline pilots, work more or less than this amount. For these and other occupations of this type, only annual wages are estimated.
Reliability
BLS uses the Relative Standard Error (RSE) to measure the reliability of its estimates. A small RSE indicates a reliable estimate. The RSE of an estimate is computed by dividing its standard error by its estimated value (for example, the standard error of the average wage divided by the estimate of the average wage).
Publication
Data collection for the May and November panels ends December 30th and June 30th respectively. However the Bureau of Labor Statistics only publishes the May panel. States send this database to the Bureau of Labor Statistics toward the end of January. It takes about six weeks for BLS to generate the wage and employment estimates, after which they transfer the estimates to the states for verification and further processing. These estimates are usually ready for publication by late June or early July.
Estimate Suppression and Survey Confidentiality
Individual occupational employment and wage estimates may be withheld from publication for a number of reasons, including failure to meet BLS quality standards or the need to protect the confidentiality of our survey respondents. In order to further ensure confidentiality, OEWS is not able to provide the specific reason that an estimate was not released. Unpublished OEWS estimates cannot be made available to the public.
In general, if either an employment or a wage estimate (but not both) is available for an occupation, the occupation will appear in the data with an "S" indicating the unpublished estimate is suppressed. If neither an employment nor a wage estimate could be published, the occupation will not be shown in the data. Occupations for which separate data are unavailable are included in the estimates for the appropriate major group category and in the "all occupations" totals. For this reason, major group and "all occupations" employment estimates may exceed the sum of the employment estimates for the available detailed occupations.
Content Reviewed: August 2023
Wage Descriptions
- Average wage (Mean wage) is the average pay earned by all workers in the selected location, occupation, and industry. It is calculated by summing the adjusted wages for all workers and dividing by the number of workers. It is a very general measure of what all workers earn.
- Average Weekly is the quotient obtained by dividing the total of the wages reported by all insured employers by the monthly average insured employment during the immediately preceding calendar year and further dividing the quotient by 52 to obtain a weekly rate.
- Entry wage is what an entry-level worker might expect to make. It is defined as the average (mean) wage earned by the lowest third of all workers in the selected location, occupation, and industry.
- Experienced wage is what an experienced worker might expect to make. It is defined as the average (mean) wage earned by the upper two-thirds of all workers in the selected location, occupation, and industry.
- 25th Percentile estimate indicates that 25 percent of the workers in an occupation earn less than a given wage. Conversely, 75 percent of the workers in that same occupation will earn more than the given wage.
- 75th Percentile estimate indicates that 75 percent of the workers in an occupation earn less than a given wage. Conversely, 25 percent of the workers in that same occupation will earn more than the given wage. For example, if the wage is $15.00, 75 percent of the workers in that occupation will be earning less than $15.00, while 25 percent of the workers will be earning more than $15.00.
Additional Resources:
Bureau of Labor Statistics (BLS) OEWS Data
Bureau of Labor Statistics - OEWS Additional Resources
Contact: Sal Serio
(608) 733-3925